

All Most Done
a defiant day

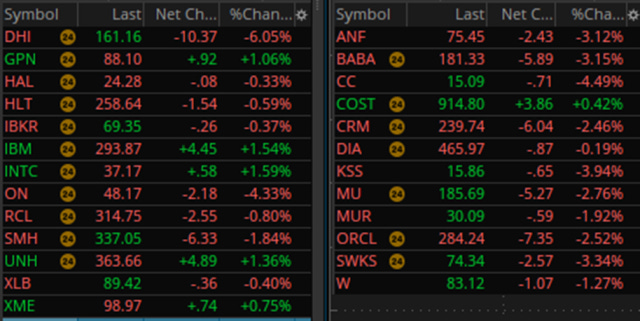
I’ll start off with a simple fact: on an intraday basis, today was the highest price level in the history of the Milky Way Galaxy on almost every major index. Also, today my entire portfolio was 25 short positions, and of those, 19 closed down and 6 closed up. Added to which, some of the downs were much meatier than the ups, the largest of which was 1.59% (versus -6.05% for the biggest down). The point I am trying to make is that carefully-selected charts can sometimes defy the market.
Yesterday’s AMD debacle was, in retrospect, an interesting gusher. Only after it was all over did I realize that the day’s high came within pennies of the lifetime high (see horizontal) and that the bar rammed right up against the long-term trendline and stayed stuck there.
