

Fix Your Little Red Wagon

The past couple of weeks have created a thrilling change in the tone and structure of the entire equity market. I see it illustrated with:
important lifetime tops at important levels of resistance;
a shift from “higher highs” to “lower highs”;
a clean succession of price gaps, which are vital for setting stop losses.
The NASDAQ Composite illustrates all three of these beautifuly.
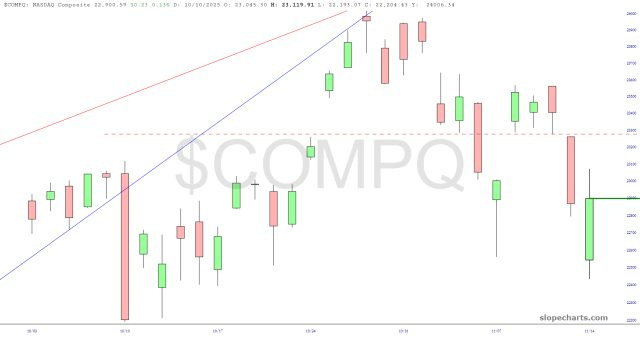
Here is the longer view, showing the massive wedge which has completed and failed.
Keep reading with a 7-day free trial
Subscribe to Slope of Hope Charts & Technical Analysis for Short Sellers to keep reading this post and get 7 days of free access to the full post archives.