

He's At it Again!
another cool (and free!) tool for you traders out there

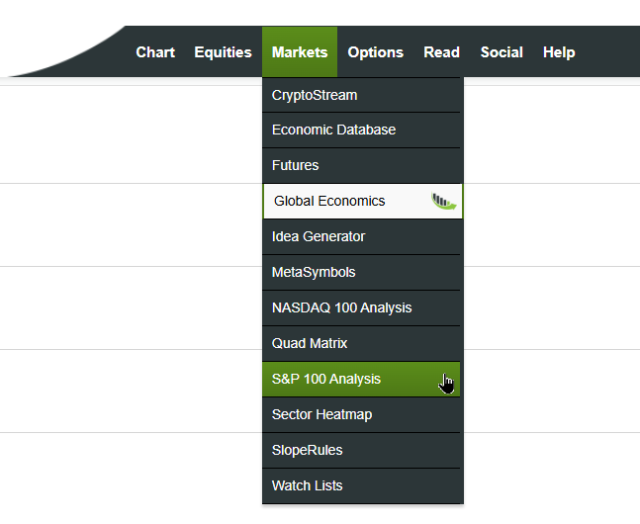
Well, my manic creation of new tools over the weekend for Slope didn’t end just because Monday showed up. Yep, I’ve added yet another feature........
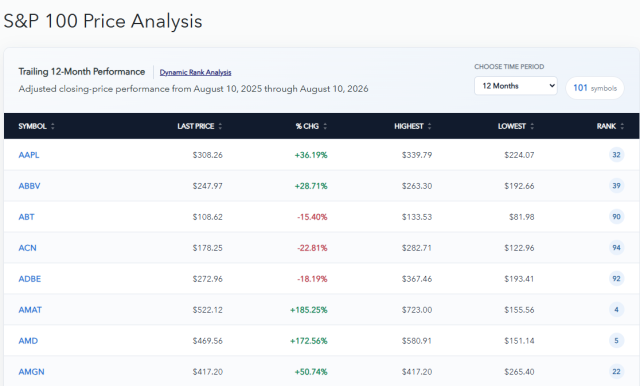
What this provides is, for the time period selected, the percentage change, highest price, lowest price, and ranking of each component of the S&P 100. And, yeah, I know there are 101 symbols in the so-called 100. It’s the same with the NASDAQ 100. Life’s weird that way.
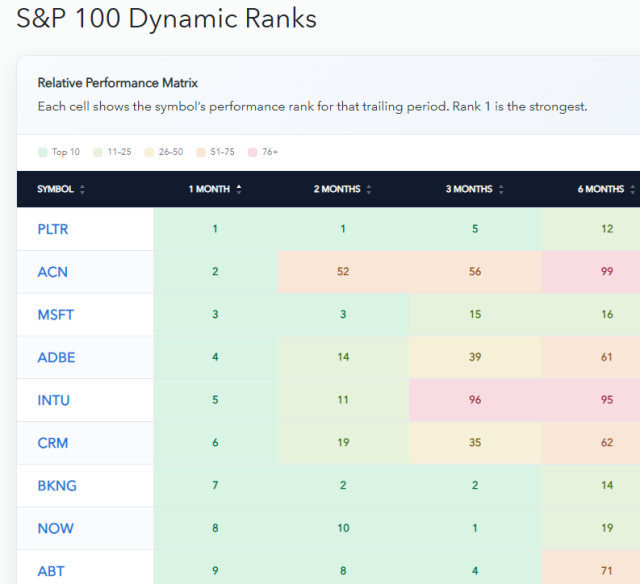
Even cooler than all that, by clicking the Dynamic Rank Analysis link, it will show you the rank for all six time periods and how they’ve changed over time, colored coded to make consistency or dynamism stick out.
I keep creating stuff on Slope that simply doesn’t exist anywhere else, and knowing how I operate, it’s just going to keep happening.
Let me know what you think.
Thank you Jimbo !