Slope of Hope Charts & Technical Analysis for Short Sellers

Slope of Hope Charts & Technical Analysis for Short Sellers

Index Signs

a quick look at five index charts

Slope of Hope's avatar
Slope of Hope
Oct 16, 2024
∙ Paid

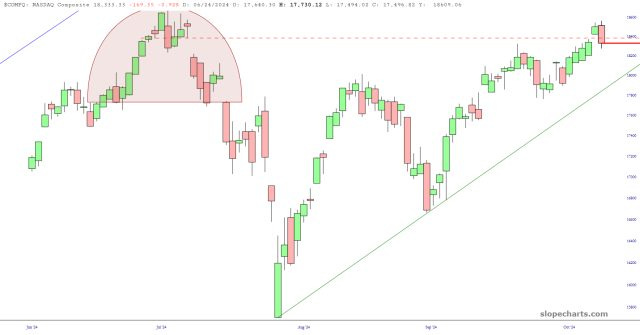
It was a very interesting Tuesday. Let's look at five index charts. The first, the NASDAQ Composite, blew past its price gap Monday, only to fall back below the gap Tuesday. Not only is it a failed bullish breakout, it is also a bearish engulfing pattern.

The exact same thing can be said for NASDAQ 100. What will it take to really get tech stocks falling…

User's avatar

Continue reading this post for free, courtesy of Slope of Hope.

Or purchase a paid subscription.
© 2026 Socialtrade Corporation · Privacy ∙ Terms ∙ Collection notice
Start your SubstackGet the app
Substack is the home for great culture