


Insouciance Needed
more rumblings from Iran

It would probably do me a world of good to not worry quite so much.
Don't get me wrong: I'm still in the game. I used to trade four portfolios, but I decided to take one out of the picture for probably a few months and leave it strictly in a simple interest-bearing account. As for the remaining three, I'm at commitment levels of 218%, 118%, and 100%.
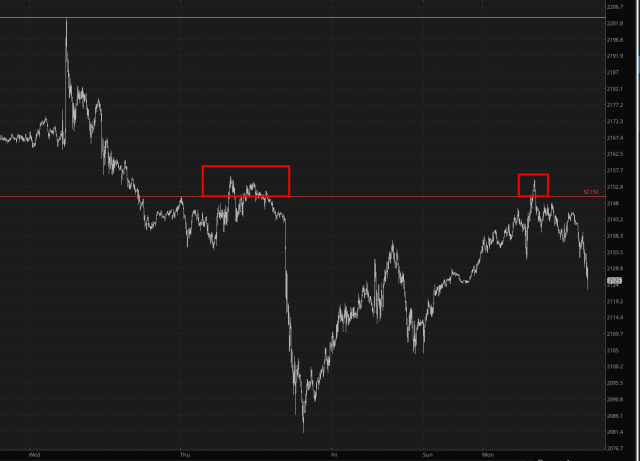
Still, I'm being rather cautious these days, and I did in fact dump my only options position (September $215 IWM puts) based on nothing more than the /RTY crossing above the Fibonacci (below). However, as you can plainly see, that exploratory gesture was beaten down swiftly, and those little pokes above $2150 haven't yet meant anything at all.
Keep reading with a 7-day free trial
Subscribe to Slope of Hope Charts for Short Sellers to keep reading this post and get 7 days of free access to the full post archives.