July ETF Update
thirteen charts to examine

As we sit here with the most expensive stock market in history, let's take a look at some ETF charts.
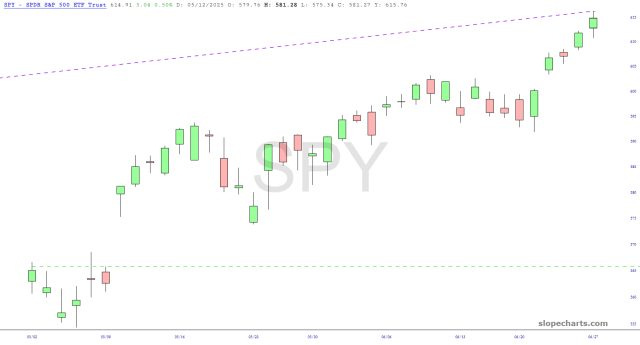
The SPY has blasted higher almost nonstop from April 7th. Indeed, checking x.com, "$SPX" is one of the top trending items, which should tell you just how many shoeshine boys are out there.
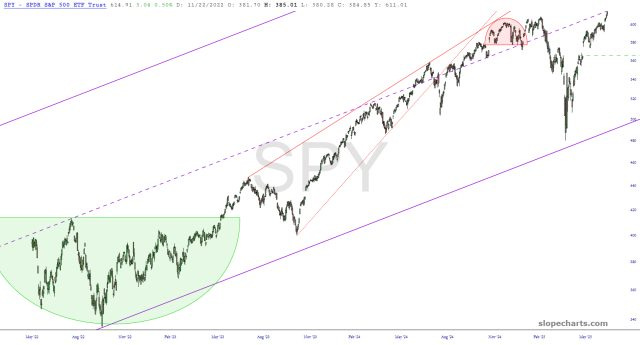
What's remarkable to me about this chart is that the SPY did an almost perfect "tag" of its multi-decade channel on April 7th, and as of now it did a perfect, and I do mean perfect, tag of the midline of this same channel. It's right to the penny.