

Last Look at Indexes

This is an extraordinarily important juncture for the market: we are either so oversold that we’re going to bounce strongly, or else we’re heading into such a big sell-off that the “oversold” state of the market doesn’t even matter. What I can say for sure is that, for the first time in an entire year, the 50-day EMA has crossed beneath the 100-day.
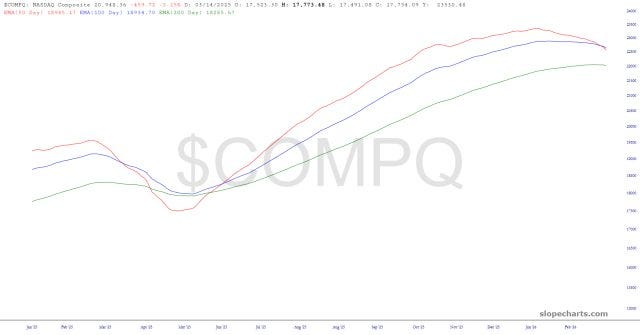
Universally, indexes fell hard on Thursday and Friday, creating a gap each time. The charts below showed a dashed red line for the most recent gap and, where appropriate, higher lines showing former gaps.
