


Major Index Look-See
catching up on the big markets

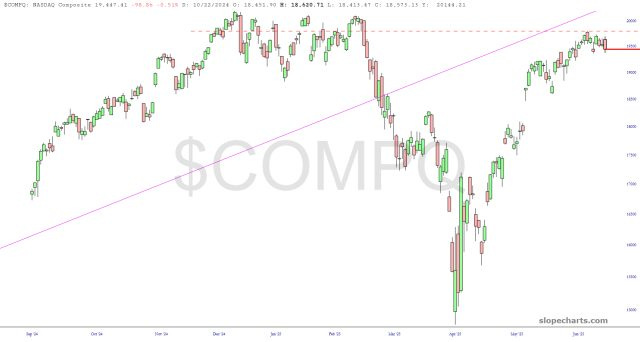
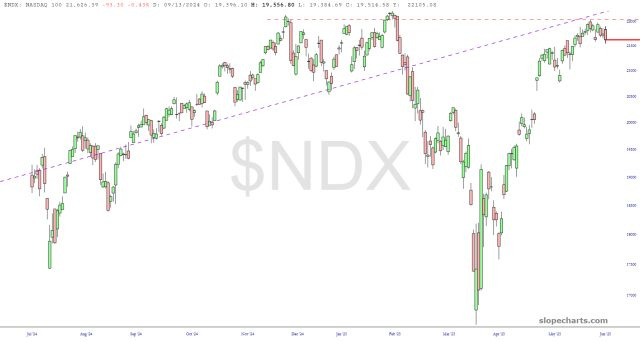
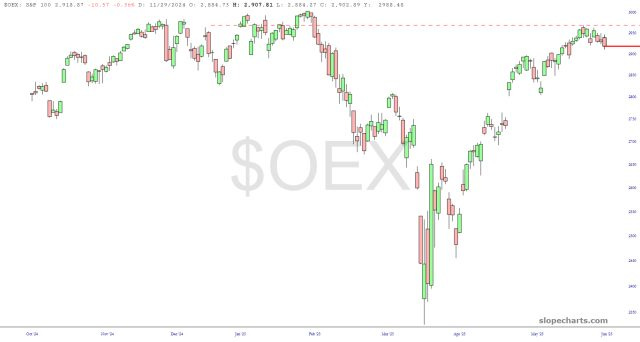
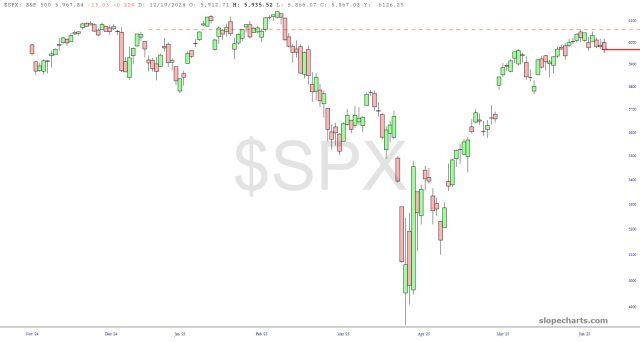
In many instances, the activities of the past few years of the major indexes can be described with a couple of simple facts:
They have broken important ascending trendlines;
Their recent massive rally has achieved nothing except to hammer out a "lower high"
Here are four examples of this, with the dashed red line anchored to the peak last week of the index (as stated, lower than the lifetime high from months earlier):
The Dow Industrials had broken a major trendline during the early April soon, and it is teetering at the precipice of that same line right now.
Keep reading with a 7-day free trial
Subscribe to Slope of Hope Charts for Short Sellers to keep reading this post and get 7 days of free access to the full post archives.