

Palladium Deep-Dive
why this is the only thing I want to buy

My relationship with palladium over the past month or so has been complex. On the long-term hand, I’m dying to own an absolutely ton of this stuff, while on the short-term hand, it concerns me that PALL will just get dragged down by any general asset washout (as has indeed been the case with recent equity weakness).
Let’s start with a good old, plain vanilla, long-term chart of the /PA futures themselves. This is a classic rounded bottom. It’s enormous, it’s well-formed, and every wriggle and wiggle has been pitch-perfect. In short, this is an absolutely screaming BUY on a long-term time horizon.
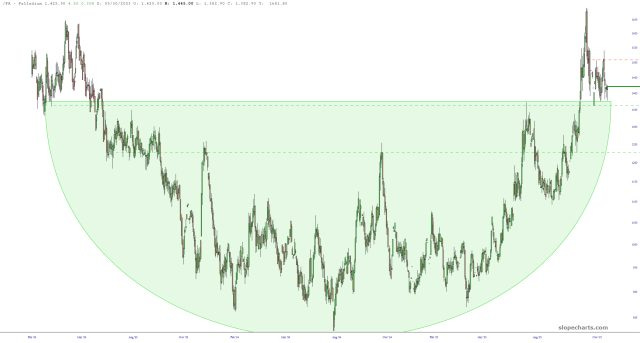
This has been the case for a while, including and up to until a month ago when it peaked. In the ten trading sessions that followed, 20% of its value got blown to smithereens. I am grateful not to have been a part of that, because one-fifth of anything is pretty nasty (since it takes 25% to get back to where you began).
As I’ve mentioned countless times, this long term vs. short-term debate in my mind has been the reason I’ve put my toe in the water a few times, only to pull it right back out. Over the course of the past month, I’ve placed hundreds of thousands of dollars in PALL trades, and if you did the math, I could probably buy myself a cup of coffee with the proceeds. I really wanted to find out how long was “long enough” to be confident that the weak hands had been shaken out.
I therefore decided to use something that I hardly ever use on Slope, which is the Measurement Tool in SlopeCharts. I thus measured the span of time from the last time we had an important peak all the way to when it finally bottomed once and for all. In that case, it also fell 20% (!!) and it took 33 bars to get there. Interesting.
Keep reading with a 7-day free trial
Subscribe to Slope of Hope Charts & Technical Analysis for Short Sellers to keep reading this post and get 7 days of free access to the full post archives.