Pause for Reflection
THAT was quite a ride.........so what's next?

On Thursday, about an hour before the closing bell, I achieved my portfolio goal for the year 2025. That is an agonizingly terrifying reality for me, since we aren't even into March yet. When things go this well for so long ("so long" being the past five trading days) it terrifies me that calamity is at hand. I get scared and cautious, although I remain fully invested.
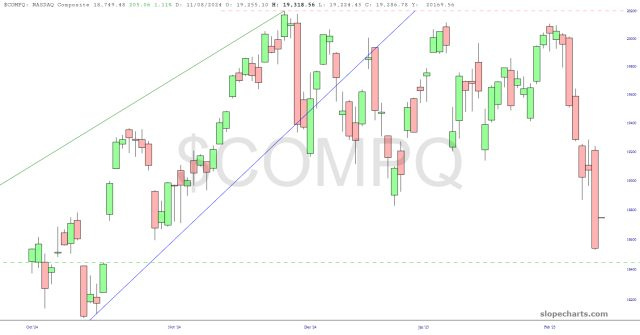
Just to exacerbate my worries, here are three major index charts that are getting quite close to a major support level, which is what I call the Election Day Gap. In each case, it is represented by the horizontal line. I would note how remarkable it is that, with all the pandering and promises made by the new administration, that the ENTIRETY of the gains based on that optimism will have been laid waste.