

Q3 Reflections
.......as we enter 2025's final quarter

It was a devilish quarter out there for any surviving equity bears (fittingly, the SPY closed at 666). Let’s go through a dozen charts on a monthly basis (as opposed to the more typical daily) to see what we can see.
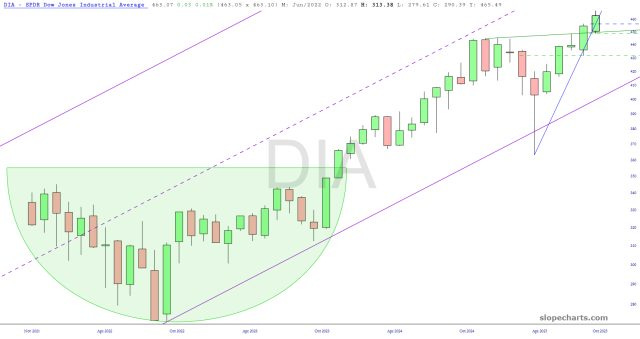
We begin with the “diamonds“, the Dow Industrial ETF, which closed at a record high. It has slightly violated its uptrend (anchored to the April 7th bottom) but, as with almost everything else, this is the fifth green monthly candle in a row.
China, by way of FXI, has roared higher, but trouble could be ahead in the form of that long-term broken trendline. That represents meaningful resistance to any meaningful further price gains. There’s only so far BABA can go up, after all.
