

Ratio Charts Update

I've gone through my entire ratio chart list (that is, those charts compromised of two or more symbols to create a unique presentation of some financial information) and wanted to share the most interesting ones with you.
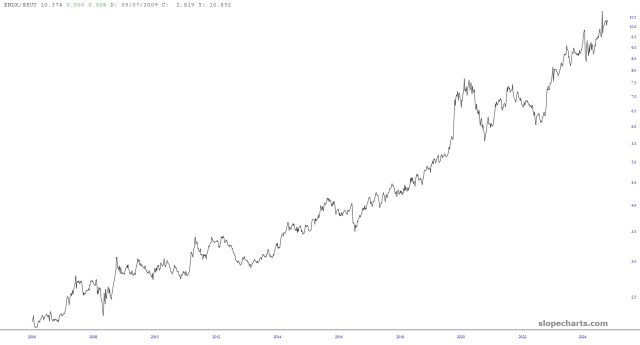
The first is the simplest: it is the NASDAQ 100 index divided by the Russell 2000. Ever since 2006, this has been climbing relentlessly, demonstrating how massively valued tech has become. Keep in mind, this isn't just illustrating the growth of the market; it is showing the growth of the market divided by the growth of the same (U.S. common stocks) market, but with different components.
There's an entire block of ratio charts which has the exact same assertion: long term, precious metals are going to beat the bejesus out of stocks. It has happened repeatedly already, and the present pattern in formation is much bigger and badder (unless you like gold!) than the rest. These charts have different equity components and different metals, but the conclusion is the same throughout.
