Slope of Hope Charts & Technical Analysis for Short Sellers

Slope of Hope Charts & Technical Analysis for Short Sellers

Russell 2000 Failure

The key level is 2100

Slope of Hope's avatar
Slope of Hope
Mar 30, 2022
∙ Paid

Just a quick “real time” post, since I was noticing, with great interest, this horizontal on the /RTY futures at 2102:

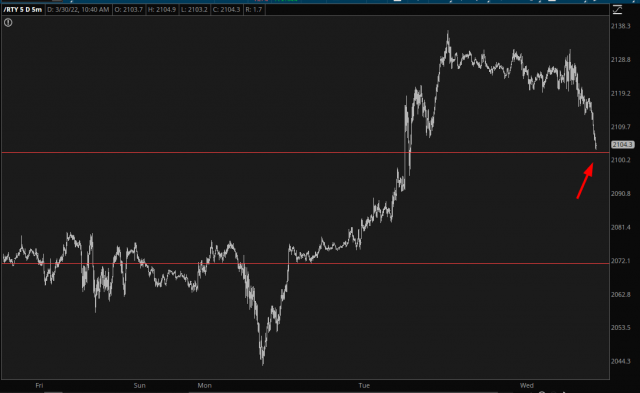
This level represents support. I zoomed way out to see what that line was all about, and yeah, it’s a big one. It’s basically the dividing line between bullish and bearish at this point. Break that sucker! Please!

User's avatar

Continue reading this post for free, courtesy of Slope of Hope.

Or purchase a paid subscription.
© 2026 Socialtrade Corporation · Privacy ∙ Terms ∙ Collection notice
Start your SubstackGet the app
Substack is the home for great culture